Jupyter Notebooks with Plotly
Updated Thu 2019-04-18 | 211 words
- Install Anaconda Python
- Create the Conda Environment
- Activate the environment
- Run the notebook
- Write the Notebook
Plotly is my current favorite Python graphing library. Here's how to use it with Jupyter Notebooks
Install Anaconda Python
Install from the website. If it gives you the option to add Python to the PATH, I suggest you take it.
Create the Conda Environment
Create a local environment. Local environments don't clutter your system install with libraries you might not want later and are easy to create and delete.
This installs the Jupyter notebook interface and plotly. It can take a while to run, so be patient.
conda create -n hello_plotly python=3 nb_conda plotlyActivate the environment
conda activate hello_plotlyconda activate and conda deactivate only work on conda 4.6 and later versions. For conda versions prior to 4.6, run:
- Windows:
activateordeactivate - Linux and macOS:
source activateorsource deactivate
I have an older version of conda and I'm on Linux, so I use source activate hello_plotly
Run the notebook
jupyter notebookThis opens up a Jupyter notebook in your browser (usually at http://localhost:8888/tree ).
Write the Notebook
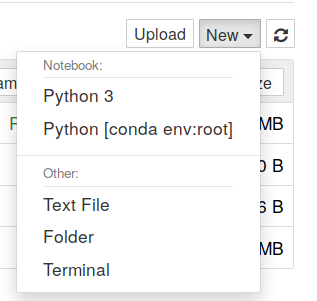
- Create the Python notebook with the "Python 3" interpreter
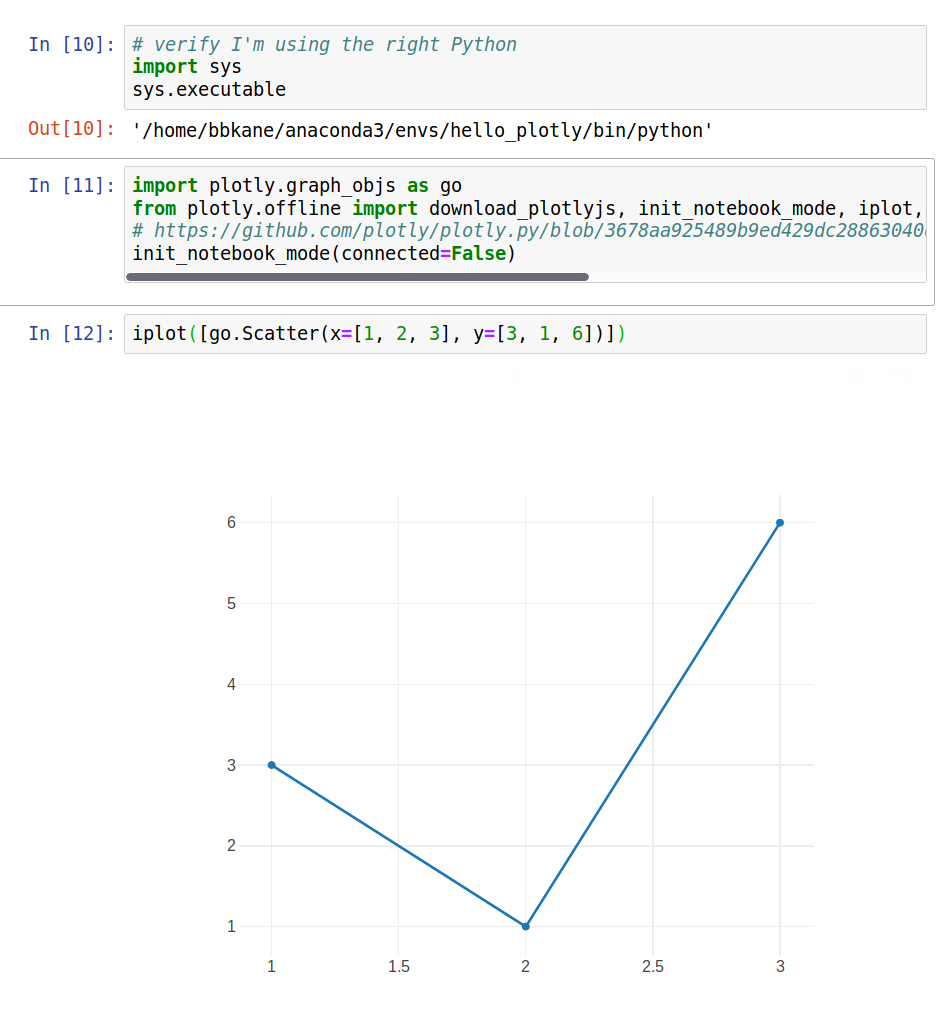
- Verify that you're using the correct Python:
# verify that I'm using the right Python
import sys
sys.executable'
- Import Plotly and initialize offline notebook mode
import plotly.graph_objs as go
from plotly.offline import download_plotlyjs, init_notebook_mode, iplot, iplot
# https://github.com/plotly/plotly.py/blob/3678aa925489b9ed429dc28863040dbb391dadb1/plotly/offline/offline.py#L243
init_notebook_mode(connected=False)- Plot something!
iplot([go.Scatter(x=[1, 2, 3], y=[3, 1, 6])])Here's a screenshot of my complete notebook for reference.