OTEL Metrics Notes
Updated Sat 2025-12-27 | 1544 words
- OTEL Metrics Architecture / Glossary
- Async vs Sync Instruments
- Instrument Types
- Metrics Hello World
- Unit Testing Metrics
- Exporting Metrics to OpenObserve
- Dashboarding
These are some notes on OTEL metrics for me to refer back to - in particular, they focus on the Go SDK and large parts are condensed from the official documentation (i.e., just the bits I feel I need to refer back to regularly for new projects).
OTEL Metrics Architecture / Glossary
Copied from here
-
Meter Provider - A Meter Provider (sometimes called
MeterProvider) is a factory forMeters. In most applications, a Meter Provider is initialized once and its lifecycle matches the application’s lifecycle. Meter Provider initialization also includes Resource and Exporter initialization. It is typically the first step in metering with OpenTelemetry. In some language SDKs, a global Meter Provider is already initialized for you. -
Meter - Metric Exporters send metric data to a consumer. This consumer can be standard output for debugging during development, the OpenTelemetry Collector, or any open source or vendor backend of your choice.
-
Metric Instruments - In OpenTelemetry measurements are captured by metric instruments. A metric instrument is defined by:
- Name
- Kind
- Unit (optional)
- Description (optional)
The name, unit, and description are chosen by the developer or defined via semantic conventions for common ones like request and process metrics.
Async vs Sync Instruments
See here for more details, but:
- Synchronous instruments are updated explicitly by your applications for metrics it's "in charge of". For example, an HTTP client could update a Counter each time it sends an HTTP request.
- Asynchronous instruments are updated via callback, usually set at the beginning of the program, that runs each export cycle. For example, a program could set the callback to measure CPU temperature.
Instrument Types
Copied from here:
Counter
Counter is a synchronous Instrument which supports non-negative increments.
Example uses for Counter:
- count the number of bytes received
- count the number of requests completed
- count the number of accounts created
- count the number of checkpoints run
- count the number of HTTP 5xx errors
Asynchronous Counter
Asynchronous Counter is an asynchronous Instrument which reports monotonically increasing value(s) when the instrument is being observed.
Example uses for Asynchronous Counter:
- CPU time, which could be reported for each thread, each process or the entire system. For example “the CPU time for process A running in user mode, measured in seconds”.
- The number of page faults for each process
Histogram
Histogram is a synchronous Instrument which can be used to report arbitrary values that are likely to be statistically meaningful. It is intended for statistics such as histograms, summaries, and percentile.
Example uses for Histogram:
- the request duration
- the size of the response payload
Gauge
Gauge is a synchronous Instrument which can be used to record non-additive value(s) (e.g. the background noise level - it makes no sense to record the background noise level value from multiple rooms and sum them up) when changes occur.
Note: If the values are additive (e.g. the process heap size - it makes sense to report the heap size from multiple processes and sum them up, so we get the total heap usage), use UpDownCounter.
Note: Synchronous Gauge is normally used when the measurements are exposed via a subscription to change events ( i.e. backgroundNoiseLevel.onChange(value -> gauge.record(value))). If the measurement is exposed via an accessor, use Asynchronous Gauge to invoke the accessor in a callback function ( i.e. createObservableGauge(observable -> observable.record(backgroundNoiseLevel.getCurrentValue())).
Example uses for Gauge:
- subscribe to change events for the background noise level
- subscribe to change events for the CPU fan speed
Asynchronous Gauge
Asynchronous Gauge is an asynchronous Instrument which reports non-additive value(s) (e.g. the room temperature - it makes no sense to report the temperature value from multiple rooms and sum them up) when the instrument is being observed.
Note: if the values are additive (e.g. the process heap size - it makes sense to report the heap size from multiple processes and sum them up, so we get the total heap usage), use Asynchronous Counter or Asynchronous UpDownCounter.
Example uses for Asynchronous Gauge:
- the current room temperature
- the CPU fan speed
UpDownCounter
UpDownCounter is a synchronous Instrument which supports increments and decrements.
Note: if the value is monotonically increasing, use Counter instead.
Example uses for UpDownCounter:
- the number of active requests
- the number of items in a queue
An UpDownCounter is intended for scenarios where the absolute values are not pre-calculated, or fetching the “current value” requires extra effort. If the pre-calculated value is already available or fetching the snapshot of the “current value” is straightforward, use Asynchronous UpDownCounter instead.
UpDownCounter supports counting the size of a collection incrementally, e.g. reporting the number of items in a concurrent bag by the “color” and “material” properties as they are added and removed.
Asynchronous UpDownCounter
Asynchronous UpDownCounter is an asynchronous Instrument which reports additive value(s) (e.g. the process heap size - it makes sense to report the heap size from multiple processes and sum them up, so we get the total heap usage) when the instrument is being observed.
Note: if the value is monotonically increasing, use Asynchronous Counter instead; if the value is non-additive, use Asynchronous Gauge instead.
Example uses for Asynchronous UpDownCounter:
- the process heap size
- the approximate number of items in a lock-free circular buffer
Metrics Hello World
This example is adapted from the documentation, and demos setup, teardown, sync and asynchronous counters. It's about as condensed as I can make it without omitting important bits.
package main

import (
	"context"
	"fmt"
	"math/rand"
	"os"
	"os/signal"
	"time"

	"go.opentelemetry.io/otel"
	"go.opentelemetry.io/otel/attribute"
	"go.opentelemetry.io/otel/exporters/otlp/otlpmetric/otlpmetrichttp"
	"go.opentelemetry.io/otel/metric"
	sdkmetric "go.opentelemetry.io/otel/sdk/metric"
)

// adapted from https://opentelemetry.io/docs/languages/go/instrumentation/#metrics

const name = "otel_metrics"

var (
	meter       = otel.Meter(name)
	rollCnt     metric.Int64Counter
	durationCnt metric.Float64ObservableCounter
)

func init() {
	rollCnt = must(meter.Int64Counter(
		"dice.rolls",
		metric.WithDescription("The number of rolls by roll value"),
		metric.WithUnit("{roll}"),
	))
	durationCnt = must(meter.Float64ObservableCounter(
		"uptime",
		metric.WithDescription("The duration since the application started."),
		metric.WithUnit("s"),
	))
}

func must[T any](v T, err error) T {
	if err != nil {
		panic(err)
	}
	return v
}

func main() {
	start := time.Now()

	ctx, cancel := signal.NotifyContext(context.Background(), os.Interrupt)
	defer func() {
		fmt.Println("calling cancel")
		cancel()
	}()

	// can use a stdout exporter
	// metricsExporter := must(stdoutmetric.New(stdoutmetric.WithPrettyPrint()))

  // or an HTTP exporter (see "Exporting Metrics to OpenObserve" below)
	metricsExporter := must(otlpmetrichttp.New(context.Background()))
	meterProvider := sdkmetric.NewMeterProvider(
		sdkmetric.WithReader(
			sdkmetric.NewPeriodicReader(
				metricsExporter,
				sdkmetric.WithInterval(5*time.Second),
			),
		),
	)
	defer func() {
		fmt.Println("calling meterProvider shutdown")
		_ = meterProvider.Shutdown(context.Background())
	}()
	otel.SetMeterProvider(meterProvider)

	// Register the observable counter
	// This callback is called every time the metrics provider exports (in our case every 5 seconds)
	reg := must(meter.RegisterCallback(
		func(_ context.Context, observer metric.Observer) error {
			observer.ObserveFloat64(
				durationCnt,
				time.Since(start).Seconds(),
				metric.WithAttributes(
					attribute.String("key", "value"),
				),
			)
			return nil
		},
		durationCnt,
	))

	defer func() {
		fmt.Println("calling meter unregister")
		reg.Unregister()
	}()

	ticker := time.NewTicker(1 * time.Second)
	defer func() {
		fmt.Println("calling ticker stop")
		ticker.Stop()
	}()
	for {
		select {
		case <-ctx.Done():
			fmt.Println("context done")
			return
		case <-ticker.C:
			fmt.Println("rolling dice")
			roll := 1 + rand.Intn(6)
			// use the synchronous counter
			rollCnt.Add(ctx, 1, metric.WithAttributes(
				attribute.Int("roll.value", roll),
			))
		}
	}
}
Unit Testing Metrics
This looks pretty simple, but actually took me (and ChatGPT) to find the right APIs to combine.
package otel_inmem_test

import (
	"context"
	"testing"

	"github.com/stretchr/testify/require"
	"go.opentelemetry.io/otel/sdk/metric"
	"go.opentelemetry.io/otel/sdk/metric/metricdata"
)

func TestMyMetrics(t *testing.T) {
	require := require.New(t)
	ctx := context.Background()
	reader := metric.NewManualReader()

	provider := metric.NewMeterProvider(metric.WithReader(reader))

	// everything is in scope in this test, so no need to set global meter provider. But if needed:
	// otel.SetMeterProvider(provider)

	meter := provider.Meter("test")
	counter, err := meter.Int64Counter("my_counter")
	require.NoError(err)

	counter.Add(ctx, 5)
	counter.Add(ctx, 10)

	// Collect the metrics
	var rm metricdata.ResourceMetrics
	err = reader.Collect(ctx, &rm)
	require.NoError(err)

	require.Equal(1, len(rm.ScopeMetrics))
	require.Equal(1, len(rm.ScopeMetrics[0].Metrics))

	err = provider.Shutdown(ctx)
	require.NoError(err)
}
Exporting Metrics to OpenObserve
Data Flow
The usual flow for OTEL metrics (as well as traces, and probably logs) is:
App -> OTEL Collector -> Observability PlatformThis works fantastically for large deployments, but for smaller deployments or dev work, it's a pain to set up. Fortunately, we can install a local instance of OpenObserve to act as both the OTEL Collector as well as the Observability Platform. This provides an easy, private way to experiment with OTEL observability, without paying most of the setup costs.
App -> OpenObserveI really enjoy OpenObserve because the devs intentionally focus on setup ease.
Install and Run OpenObserve
After downloading OpenObserve, start it with command similar to the following (or see the docs if you want to configure it more):
ZO_ROOT_USER_EMAIL=root@example.com \
ZO_ROOT_USER_PASSWORD=pass \
./openobserve
Then head to http://localhost:5080/web/ingestion/recommended/traces?org_identifier=default and note configuration we'll use to connect:
OTLP HTTP
HTTP Endpoint: http://localhost:5080/api/default
Authorization: Basic cm9vdEBleGFtcGxlLmNvbTpabFhiTXZTMENYSEtubzJ4
The authorization header base64 string changes for each installl. Make sure to copy it from the link.
Emit metrics
Use the code from the Hello World above.
The most important bit here is the exporter set up:
metricsExporter := must(otlpmetrichttp.New(context.Background()))This tells our code to export our metrics over HTTP. We'll use env vars to tell the collector where to send these metrics.
Run our code with OTEL env vars set
Next, we need to run our app with the appropriate exporter OTEL_* env vars set so it can connect to our local OpenObserve instance:
OTEL_EXPORTER_OTLP_ENDPOINT='http://127.0.0.1:5080/api/default' \
OTEL_EXPORTER_OTLP_HEADERS='Authorization=Basic cm9vdEBleGFtcGxlLmNvbTpabFhiTXZTMENYSEtubzJ4' \
go run .
View Metrics from OpenObserve
Head to the metrics tab, and run a query. I like to use "Auto" and click the values in the sidebar to form my graph:
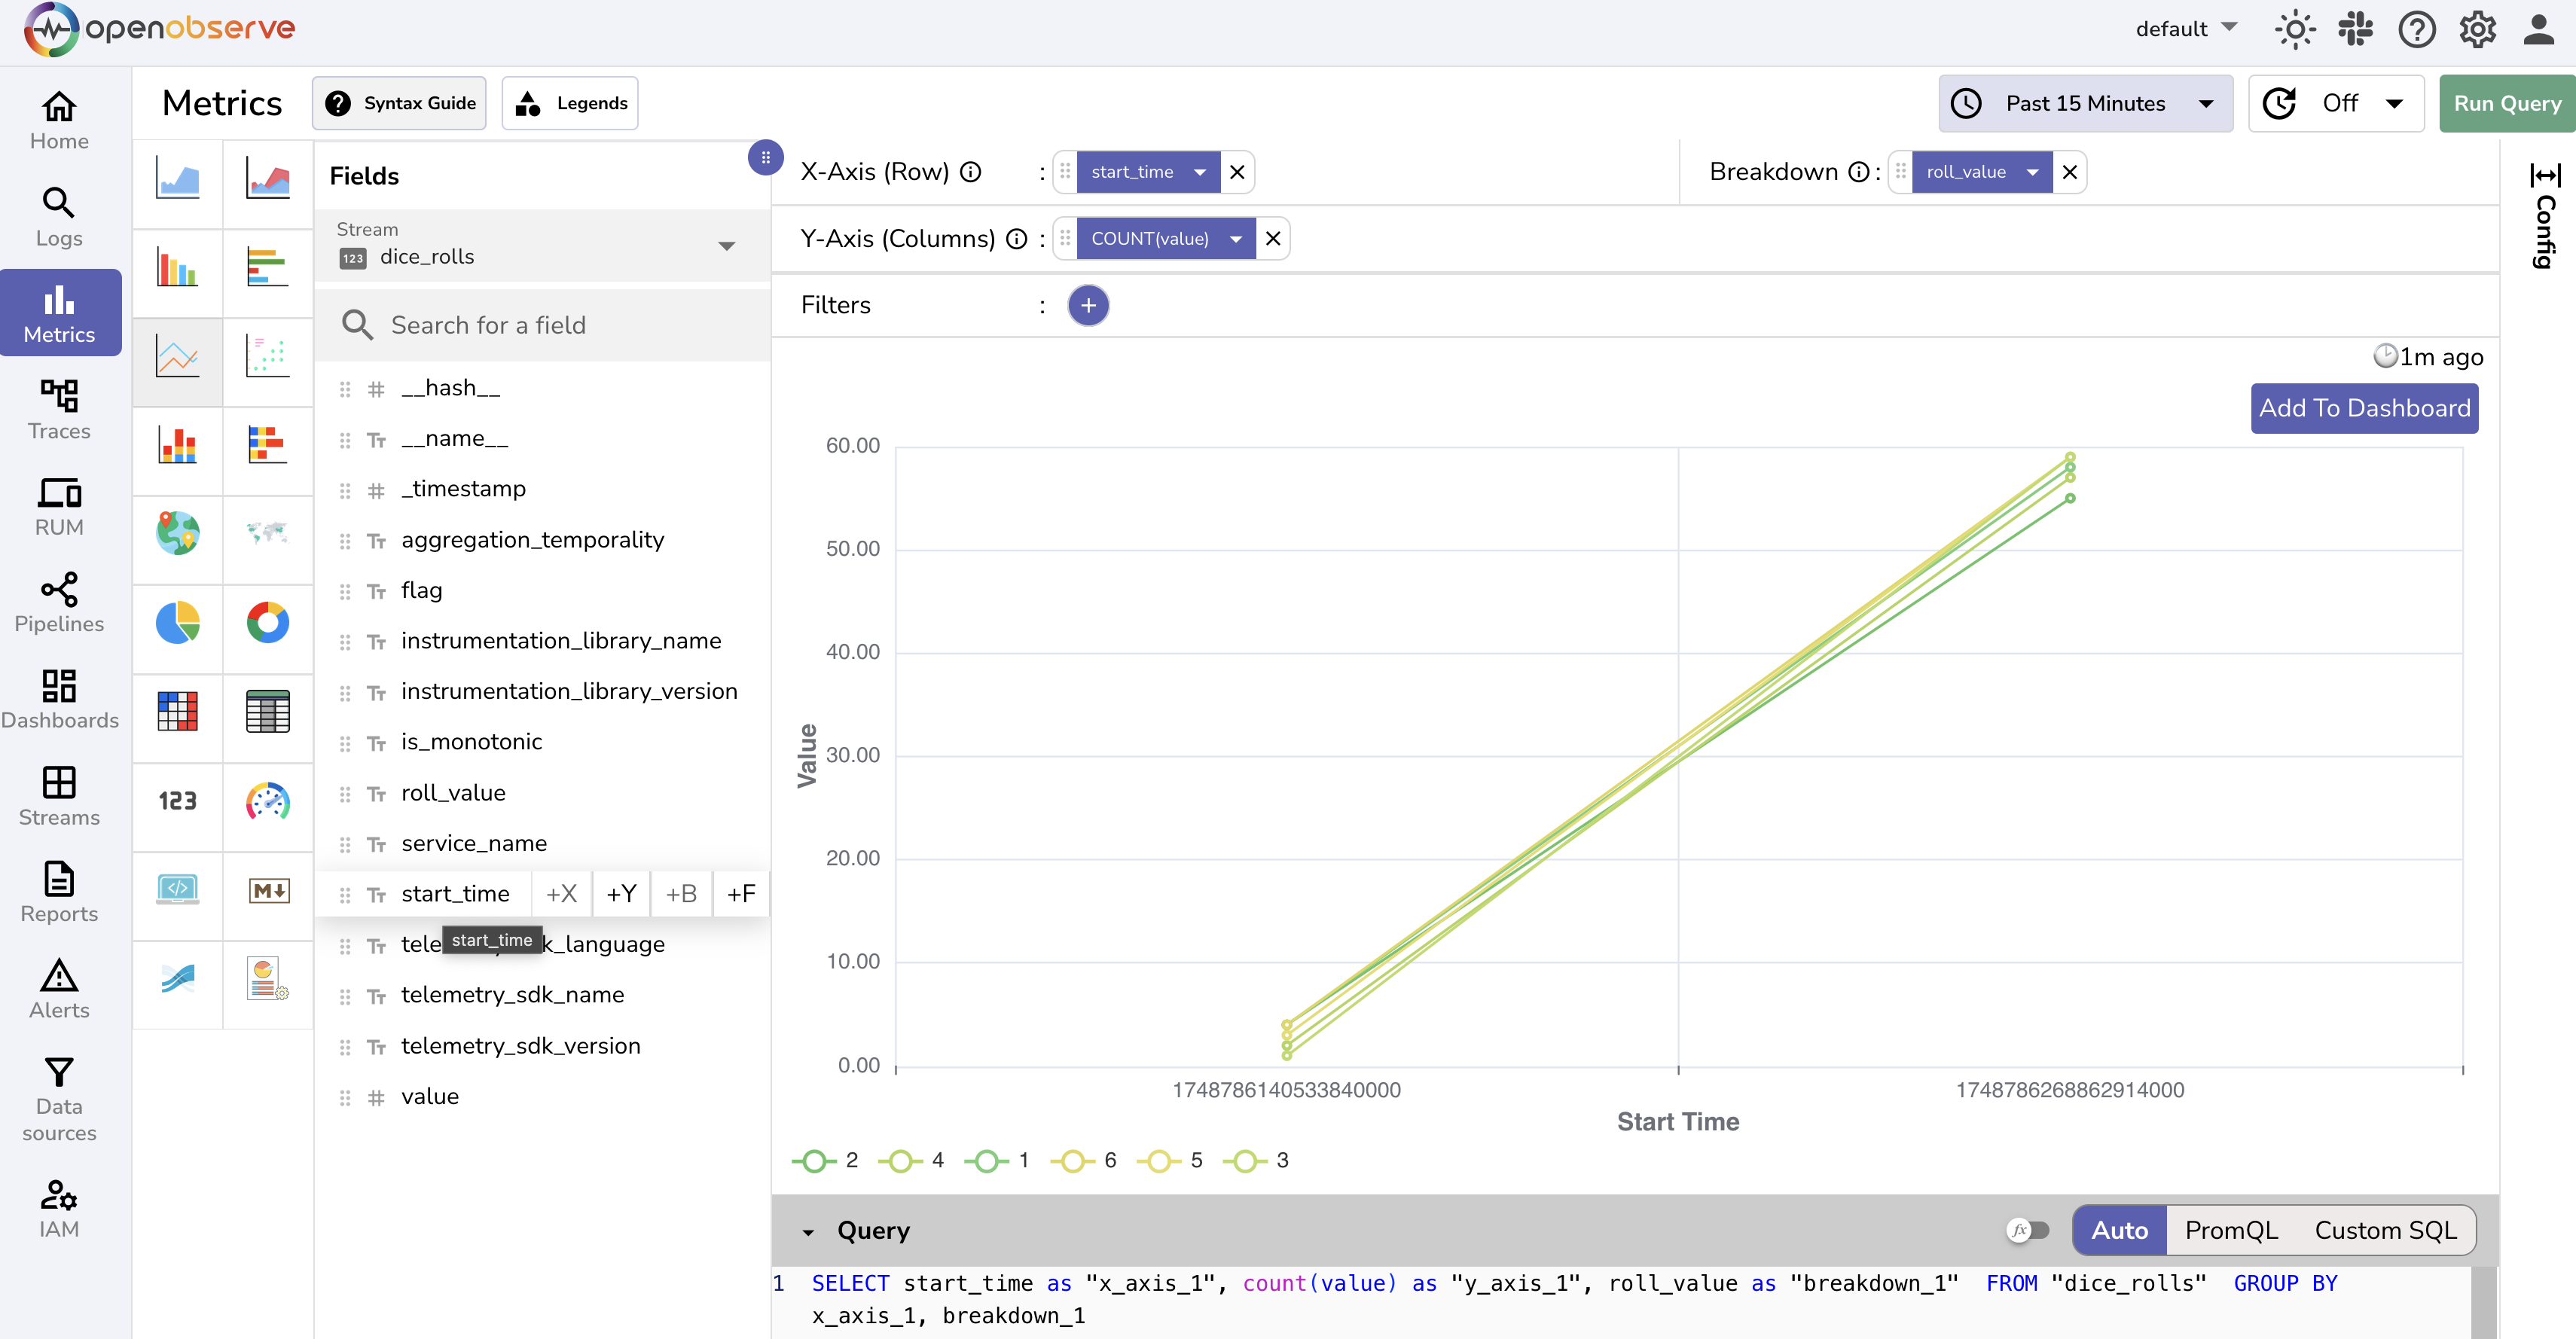
In this screenshot, I:
- selected the
dice_rollsstream - changed the query method to "Audo"
- Clicked
+Xforstart_time - Clicked
+Bforroll_value - Clicked
+Yforvalue - Clicked "Run Query"
As expected, we can see that our dice is fair - in that timespan and several rolls, each number continues to show an equal probability of being rolled.
Next Steps
Of course, this is the bare minimum to get started with OTEL and OpenObserve. Further ideas:
- Skip the local install step and send metrics to OpenObserve Cloud
- Install OpenObserve on a server you control (I do this with Ansible)
- Send traces / logs to OpenObserve as well!
- Make a dashboard with these metrics
Dashboarding
See the Observabilty section of Software Engineering Ideas that Influence Me (maybe I should move that here)