Tiling Crosses (Linear Algebra in disguise)
Updated Sun 2017-10-08 | 642 words
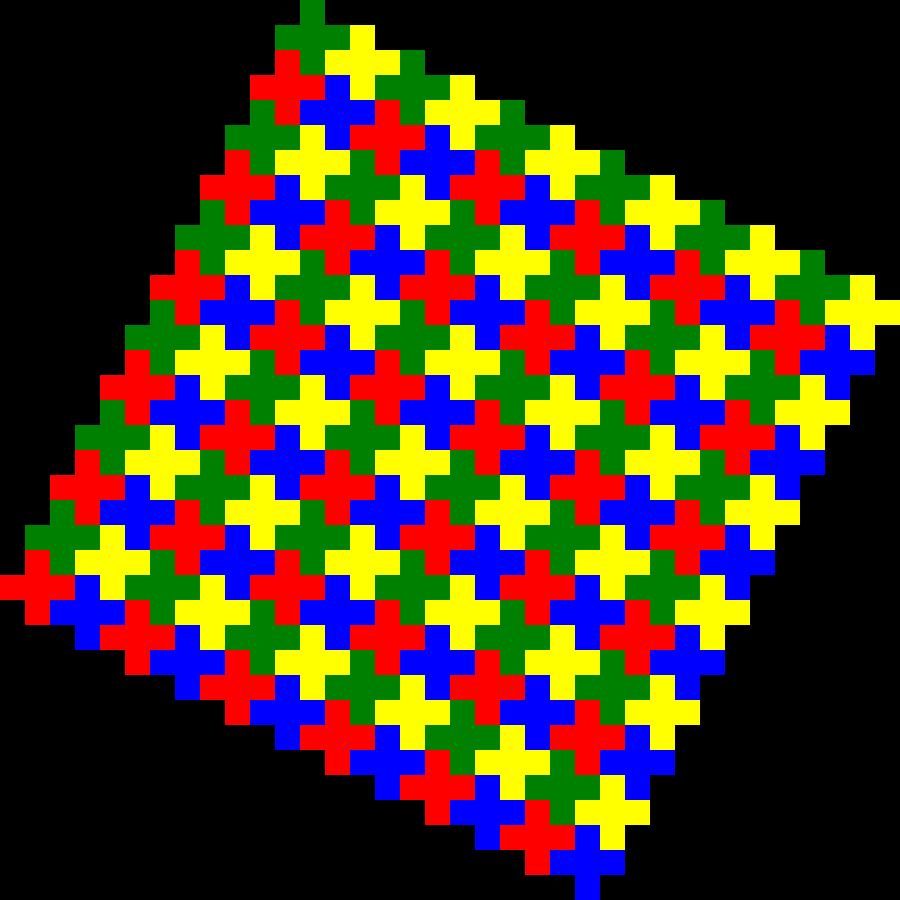
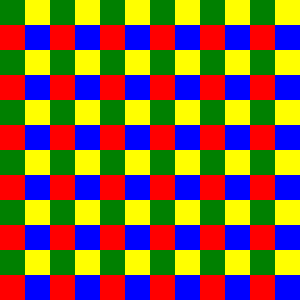
I was doodling with crosses on graph paper and was surpised to see that I could cover the graph paper with only cross shapes. They also look pretty neat when colored oddly, so I wrote code producing images similar to the below image to play with them more efficiently. While inspecting the pattern on graph paper, I noticed that if you tilt it sideways, the crosses would fit into a square. Since it's so much easier to reason about a square than a bunch of cross shaped tiles, I simplified the code by doing all the pattern work on the square, then using the formula described below to generate the cross pattern.
The cross pattern:
The square pattern for the cross pattern:
The neatest part of the code is the transformation algorithm:
// transform a point in s to the center of a cross in c
// derivation in README
function transformPoint(point: Point, point_field: SquareField): Point {
  let new_x = point_field.n + point.x * 2 + point.y * -1;
  let new_y = 1 + point.x + point.y * 2;
  let ret = new Point(new_x, new_y, point.color);
  return ret;
}
I wanted to note how I came up with the formula for transformPoint. I need to
talk to my old Linear Algebra professor to get his perspective on how I might
have been able to solve this more efficiently somehow.
The goal is to map a point in $$P$$ (a square field of points (really also squares)) to the center of a cross in $$C$$ (a square field of crosses turned caddy-corner).
Graph paper and square counting led to the following table (where x is the row, y is the column and indices start at 1):
| side length of $$P$$ (called $$n$$) | 1 | 2 | 3 | 4 |
|---|---|---|---|---|
| side length of $$C$$ | 3 | 6 | 9 | 12 |
| $$x_0$$ in $$C$$ | 2 | 3 | 4 | 5 |
| $$y_0$$ in $$C$$ | 2 | 2 | 2 | 2 |
Those are some very easily predicted patterns and we can get the following information from them:
- the origin in $$P$$ : $$(1, 1)$$ (I chose the top left corner) is mapped onto $$(n + 1, 2)$$ in $$C$$ (these are the $$x_0$$ and $$y_0$$ in $$C$$ from the table above)
- the number of tiles required to map a $$P$$ of size $$n$$ to $$C$$ is $$n * 3$$
By inspecting the graph, we can also see the following shifts:
- $$(x + 1, y)$$ corresponds to $$(x + 2, y + 1)$$. When you shift a square to the right in $$P$$, the corresponding center square in $$C$$ is shifted to the right $$2$$ and down $$1$$ (In graphics, the vertical axis typically goes from top to bottom).
- $$(x, y + 1)$$ corresponds to $$(x - 1, y + 2)$$. Similar explanation to the above.
Now a formula can start to be derived. We can scale the shifts in $$x$$ and $$y$$ by multiplying by a constant and to make it a real formula instead of just a correlation we simply add the offset from the orgin:
$$(x + \Delta x, y + \Delta y) \rightarrow (n + 1, 2) + \Delta x(x + 2, y + 1) + \Delta y(x -1, y + 2)$$
If we simply set $$x$$ and $$y$$ to $$0$$, we end up with a formula for coordinates from the origin:
$$(\Delta x, \Delta y) \rightarrow (n + 1, 2) + \Delta x(2, 1) + \Delta y(-1, 2)$$
Finally, though I've been using indices starting at one, in programming we usually start indices at zero. It's a simple matter to subtract one from the origin part of the formula. In this final form, I'm also renaming $$\Delta x$$ to $$x$$ and $$\Delta y$$ to $$y$$ because at this point they're offsets from the origin just like any other points.
$$(x, y) \rightarrow (n, 1) + x(2, 1) + y(-1, 2)$$
Generalization
I'm pretty sure this generalizes to vector spaces of any dimensionality. To get from space $$A$$ to space $$B$$, add the origin in $$B$$ to a constant times a whatever the unit vector in $$A$$ maps to in $$B$$ for each unit vector in $$A$$. One of these days, I need to add a proof for that.